Context & Reference
Bitcoin Financial Models
Frameworks used to model Bitcoin as a new asset class.
Bitcoin entered markets as a novel asset with no established valuation framework. Early price discovery was driven by small groups of participants. Over time, education, exchange infrastructure, regulatory clarity in some jurisdictions, and the development of investment products have broadened participation. Registered investment advisors, public companies, and institutional allocators now evaluate Bitcoin alongside traditional asset classes. This transition does not imply that any particular model is correct. It does mean that market participants have begun applying quantitative tools that were previously used for equities, commodities, and other scarce assets.
The models below are descriptive. They attempt to organize historical data or project possible future ranges under stated assumptions. None of them predict price with certainty, and all of them are sensitive to the inputs and time periods chosen. They are presented here as educational material, not as investment recommendations.
Stock-to-Flow
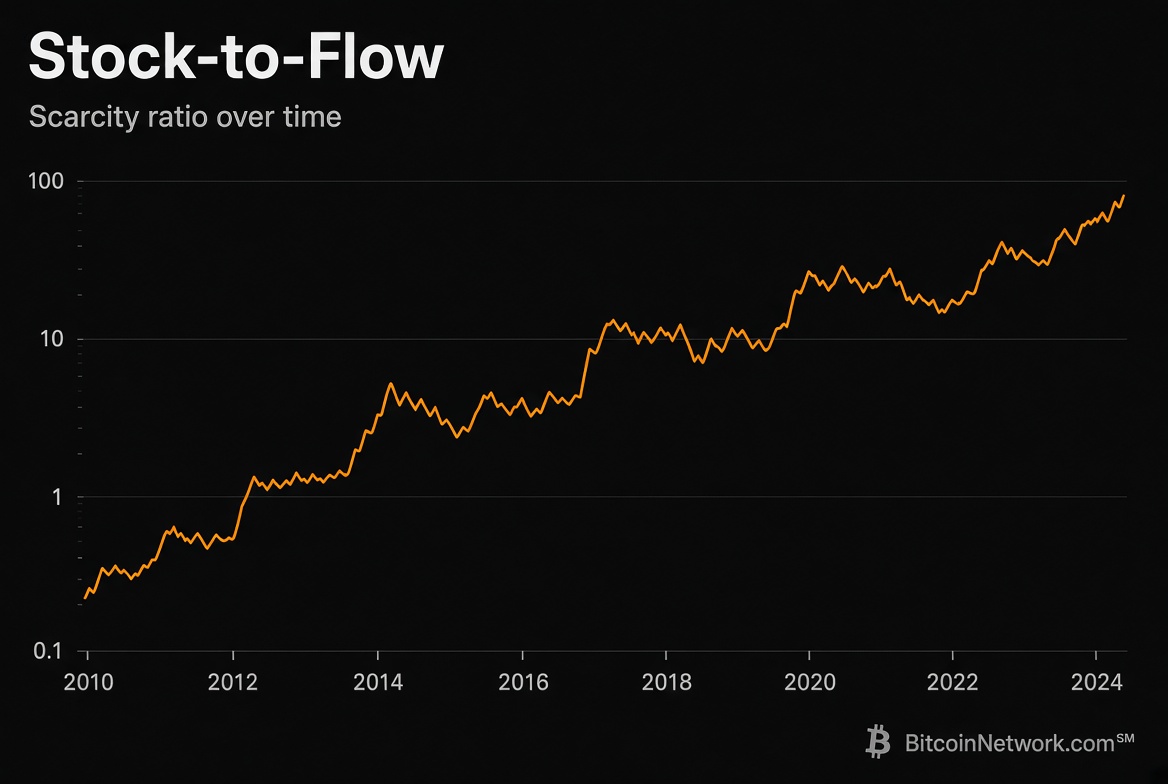
Stock-to-flow compares the existing supply of an asset (stock) to the new supply produced in a given period (flow). A higher ratio indicates greater scarcity. The model has been applied to gold and silver for decades and was later adapted to Bitcoin because of its predictable issuance schedule. Bitcoin’s stock-to-flow ratio increases with each halving as the flow declines. Critics note that the model does not account for demand, and that past correlations do not guarantee future relationships. It remains one of the most widely discussed scarcity frameworks for Bitcoin.
Power Law
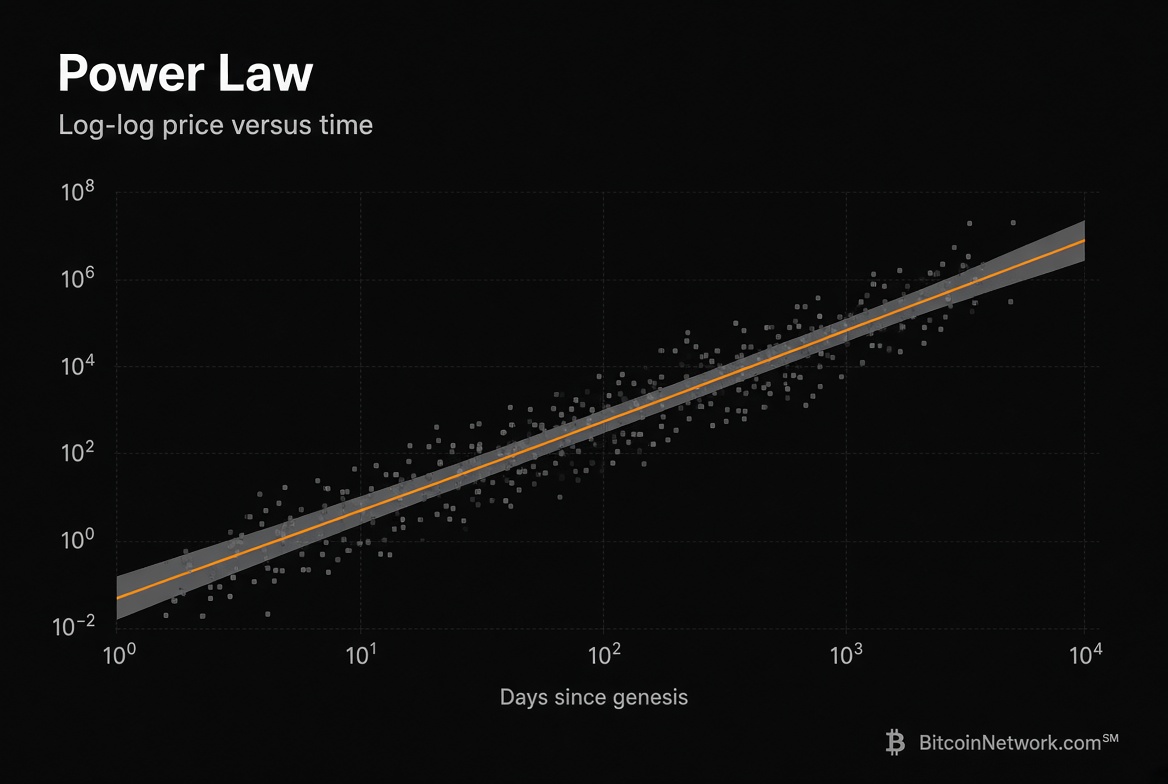
Power-law models observe that Bitcoin’s price has historically followed a log-log relationship with time. On a chart with logarithmic scales for both price and days since genesis, the long-term trend appears roughly linear. Proponents argue that this pattern is consistent with network growth and adoption curves seen in other technologies. The model produces a range rather than a single price target and is typically presented with upper and lower bounds. Like other trend-based models, it assumes that the historical relationship continues, which is not assured.
Monte Carlo
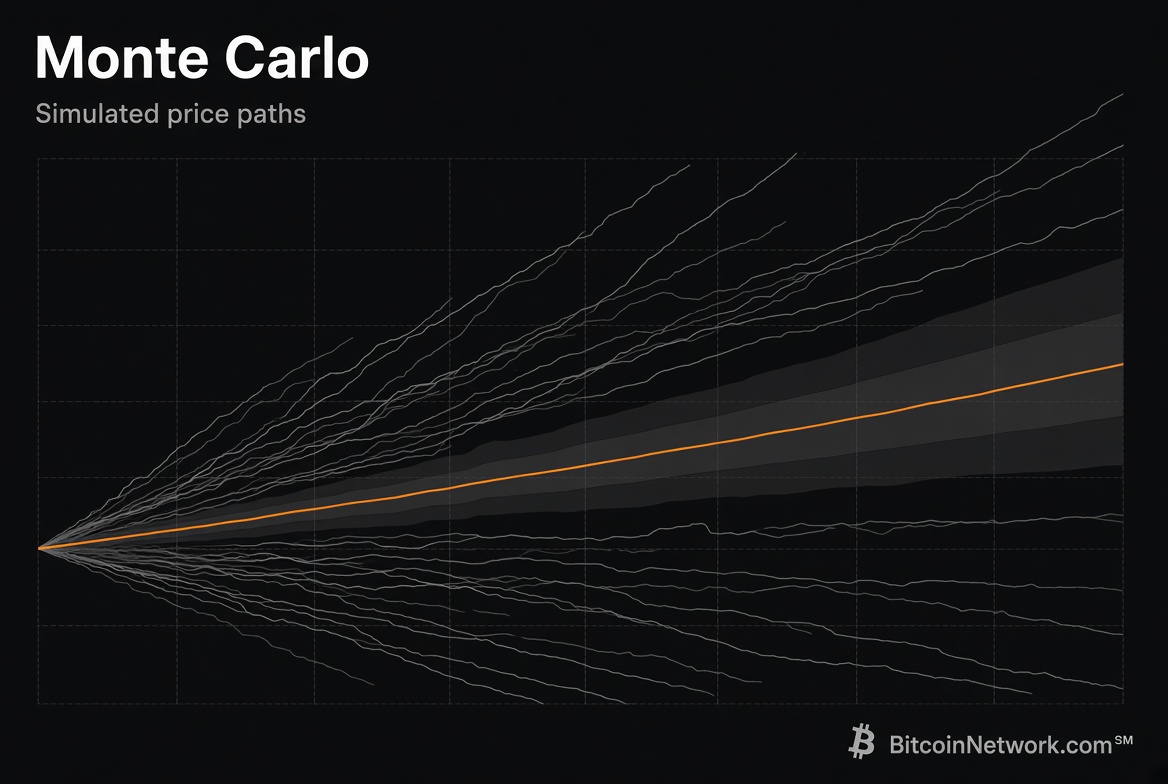
Monte Carlo simulation generates thousands of possible price paths by sampling from historical volatility and return distributions. The output is a probability distribution of future prices rather than a single forecast. For Bitcoin, the method can incorporate the declining issuance schedule, different volatility regimes, or correlations with other assets. The results are only as reliable as the assumptions about volatility and the length of the historical sample. Monte Carlo is commonly used by institutions to stress-test portfolios that include Bitcoin.
Other Frameworks
Additional approaches include network-value-to-transactions ratios, realized capitalization, and cost-of-production estimates based on mining economics. Each emphasizes a different variable: on-chain activity, the price at which coins last moved, or the marginal cost of creating new supply. None of these models is universally accepted. They are tools for organizing data and testing assumptions. The common limitation is that they cannot capture changes in regulatory environment, technological development, or shifts in demand that have not yet occurred.
Price vs. 200-day Average (Realized Proxy)
Price compared with a 200-day simple moving average. Used here as a transparent proxy for realized price.
MVRV Proxy
Price divided by the 200-day average. Values above 1 indicate price is above the long-term average.
Logarithmic Bands (Rainbow Style)
Price with simple logarithmic regression bands. Educational visualization only.
These models are educational. They do not constitute investment advice. Bitcoin remains a volatile asset whose future path depends on adoption, regulation, and broader market conditions.